Caught Looking: Articles of the Week — August 13

Here are three studies the R&D department at Driveline read this week:
The Ulnar Collateral Ligament Responds To Stress In Professional Pitchers
Injury prevention in baseball is often discussed in terms of mechanics and decreasing the load on the body, but understanding tissues’ mechanical properties can also provide insight into how to avoid injury. The better we understand workload and how the body responds to stress throughout the various training cycles and seasons, the better we can address injury risk.
Chalmers et al. conducted a study on minor league baseball players using ultrasound imaging to assess the physical properties of the ulnar collateral ligament (UCL) at the beginning of a season, at the end of that season, and again at the beginning of the next season. Ligament thickness and laxity (stretchiness) were evaluated at these three points by using the ultrasound imaging. They found that the UCL becomes thicker and more lax (more stretchy) during the season, but becomes thinner and less lax (tighter) during the off-season. This suggests that the UCL responds to the in-season workload by becoming thicker and looser, but during the offseason programs of the included subjects, the UCL became thinner and tighter.
UCL thickness and laxity were measured at three different instances of time
A couple of limitations (which the authors do a good job of addressing): physical properties of the UCL are very difficult to measure, the study only included professional baseball players within the same organization (so likely their training is similar), and longitudinal datasets (data collected over a long time with the same subjects) often have a lot of unwanted contributing factors outside of what is being measured. Despite these limitations, and a few more listed in the study, this study is very insightful for learning how the UCL responds to an in-season and off-season workload. Furthering this research will hopefully allow us to better prepare athletes for the workload of a season and/or adjust in-season workloads appropriately.
Check out our blog about elbow load and its relationship with velocity.
The prediction of swim start performance based on squat jump force-time characteristics
As we continue integrating force plates into our assessments and research here at Driveline, some of those natural progressions include determining what metrics are related to performance (usually pitch velocity) and making a predictive model out of those metrics. For example, we could look at the various force plate metrics that we collect in our jump assessment and create a statistical model to predict how hard they should throw based on their jump performance.
This is another good example, only with swimming starts. Thng et al. in Australia created a predictive model for swim start times (lower is better; corresponds to a faster start) with “lower body force-time” metrics during the squat jump. The squat jump is a jump in which the subject gets into a preset squat position, holds that position for a non-zero amount of time, and jumps from the squat with no additional counter-movement.
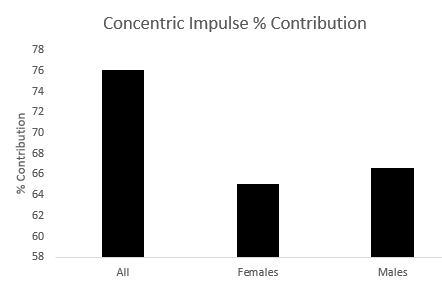
Concentric imPulse—which is equal to force multiplied by time of the force development in the concentric phase of the jump—was found to be a significant predictor of decreased start times to 5 meters and to 15 meters for men and women. A few other metrics such as concentric mean power, reactive strength index, and concentric rate of power development showed some relationship with some of the athlete categories, though not as consistently as concentric imPulse.
The group also found that for males, there seemed to be diminished returns (more performance on this metric wasn’t related to better start times) around 200-230 Ns which is a really cool addition to their statistical analysis.
Percent contribution of the squat jump concentric imPulse metric for predicting swim start times. Made with tabular data from Thng et al.
Although the swimming start is very different from the throw or the swing, this method is a good one to incorporate in our quest to find important ground reaction force (force plate) metrics in baseball. We are currently doing some similar predictive model work based on the jump testing we have done for our in-gym athletes thus far, which we aim to publish in a blog in the coming months.
Read some of our early work with force plates and what we have found relates to pitching velocity.
Use of Visual Feedback During Jump-Squat Training Aids Improvement in Sport-Specific Tests in Athletes
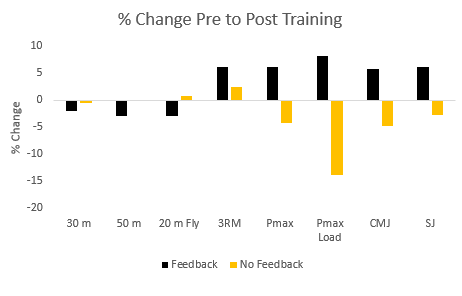
Keeping your mind in the weight room, let’s switch over to training protocols instead of assessments and tests. Vanderka et al. looked at how the incorporation of instant power production feedback affected the efficacy of a training program by comparing changes in sprint times, three rep maxes, maximum power, and jump heights between an experimental (a group that had instant feedback during training and a control (a group that was not provided power production feedback). They included many different types of athletes.
The experiment showed that in every test except for maximum power, the experimental group who received instant feedback during their training whereas the control group who didn’t receive instant feedback during their training did not significantly improve in any of the tested variables. Further, the control group actually decreased in performance for maximum power, optimal load (the load in which they create the most power), and squat jump height.
Percent change for feedback and non-feedback groups from pre- to post-training period. Made with tabular data from Vanderka et al.
Using performance feedback (power in this case, ball velocity in many throwing programs) is consistently revered as one of the more important parts of achieving training results. This study provides more evidence for this use of instant feedback outside of just the skill. For baseball, maybe that feedback includes bar velocity during lifts, sprint times during sprint training, or power production feedback in addition to the ball velocity and bat speed feedback we currently provide.
By Kyle Lindley (@kylelindley_)


Comment section