Comparing Flat Ground to Mound Elbow Torques

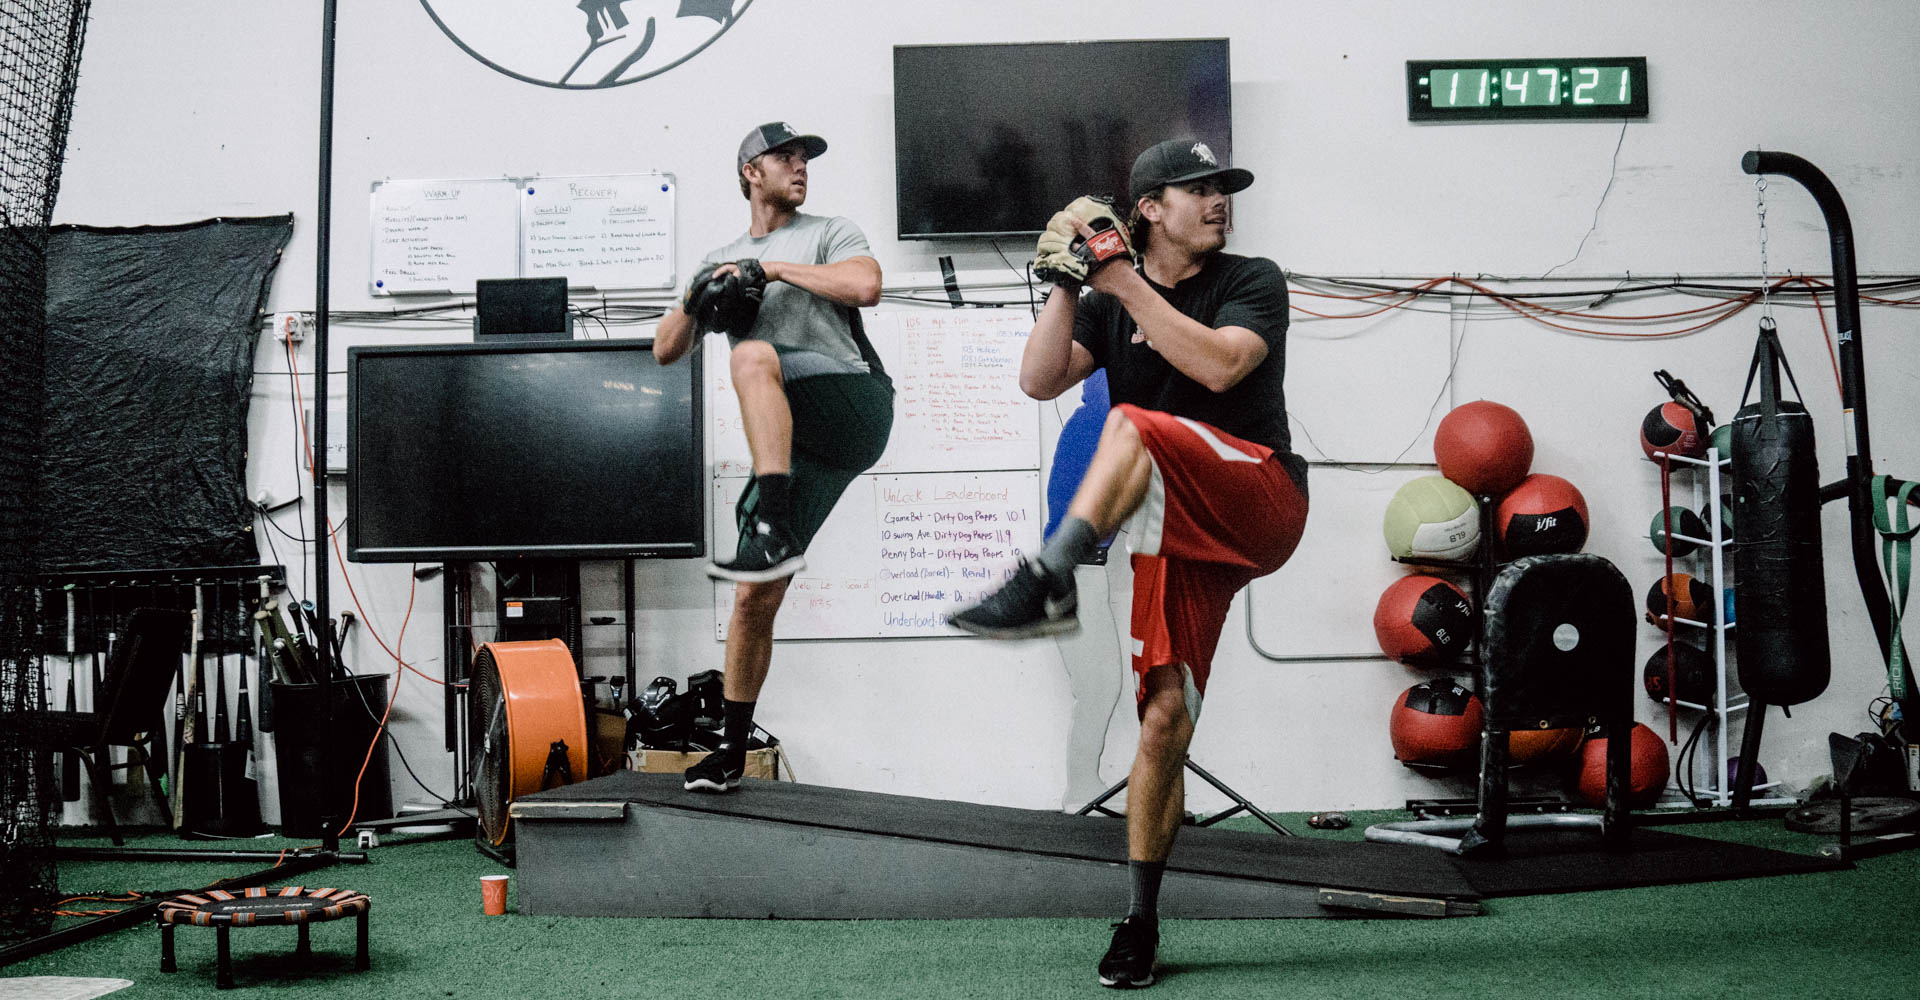
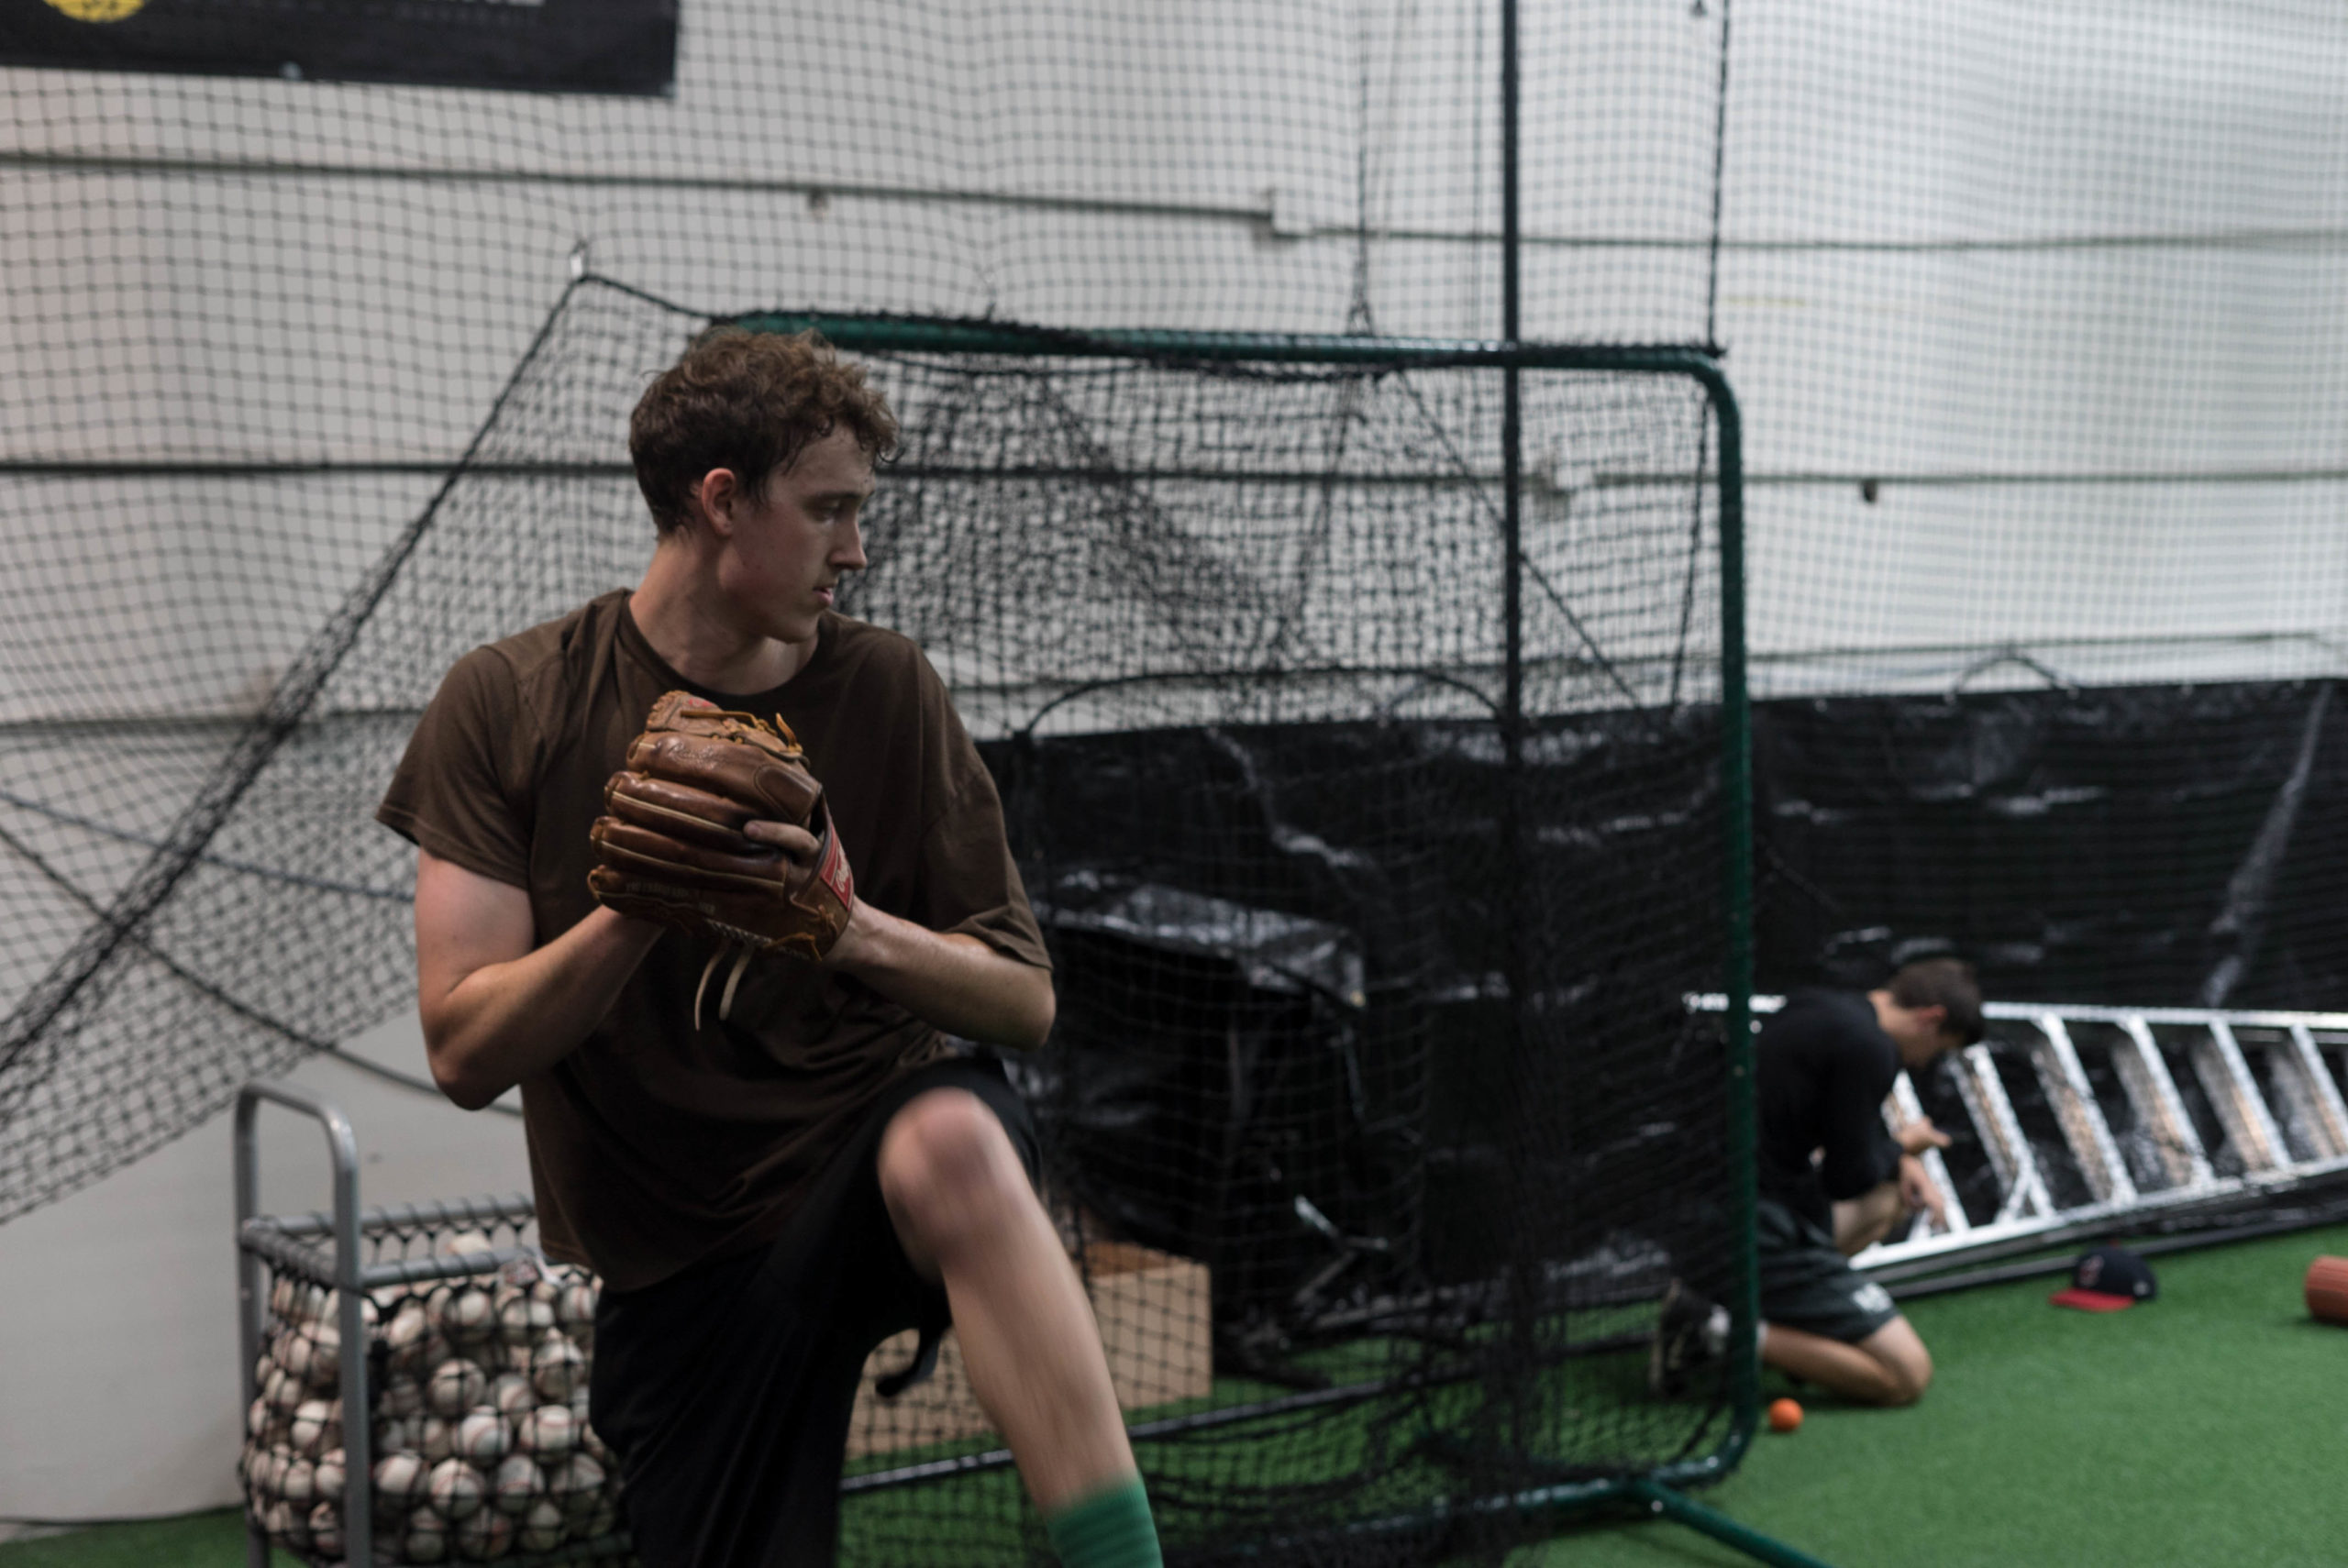
This summer we wanted to research one of the more commonly implemented ways to practice pitching: flatground work. Flatground work is often seen as a less stressful way to practice not only mechanics but also work on command and offspeed pitches.
We wanted to investigate this while using the Motus Sleeve. To do so, we took 25 athletes, recorded 6 flat-ground throws then compared the velocity and stress to those athletes throwing in our live ABs. All athletes were instructed to throw their flatground throws at 70-80% intensity, and live ABs simulated game-like intensity. The 6 flat-ground throws were compared to the 6 fastest fastballs from live ABs.
This gave us a sample that compared a common practice setting (flatgrounds) to a game situation (live ABs).
We expected that velocity and stress would decrease during the flatground throws in a way that mStress would be similar between flatground and live ABs.
We’ve explained how we use the Motus Sleeve here and it has been validated with ASMI’s lab, which you can read more about here.
Data
On average, each athlete threw flatgrounds 10 mph slower than on the mound, and the average stress decreased by 3 Newton metres (Nm). Taking velocity into account, with mStress, we can see that flatground throws ranked higher than pitching off the mound.
We’ve further define mStress here, the calculation is (Stress/Velocity*100) and it is intended to normalize the stress with velocity. You can also find the full flatground data set here.
Whether flatgrounds are more, less, or the same stress as live ABs depends on what measurement you prefer. When examining Nm (or Torque on the elbow), flatgrounds are less stressful than throwing off the mound. But, by normalizing the stress for velocity (mStress), then flatgrounds become slightly more stressful than pitching off a mound.
This was an unexpected finding, the assumption by many players and coaches is that the stress on an athlete’s arm would linearly decrease (or increase) with velocity. This data, especially the mStress metric, contradicts that belief.
15 of our pitchers had higher elbow torques when throwing during live abs, which means 10 pitchers had higher elbow stress when throwing off of flatground. Not at all what we were expecting.
Taking velocity into account, we saw 20 pitchers had higher mStress on flatground than on the mound.
Our best hypothesis for this would be a lack of movement efficiency on flat ground, athletes should be practicing to have their best movement on the mound, since that is where they compete. This, combined with the evidence that stress doesn’t linearly decrease or increase with velocity, is the main reason why athletes would experience higher stress on flatground throws.
Study Limitations
The majority of this data was collected within a few days of an athlete’s schedule. Because of scheduling issues, two were collected on the same day that the athletes threw live and two were two weeks apart.
Halfway through the data collection, we had to switch radar guns because our original Stalker Pro 2 malfunctioned, so we continued data collection with a Stalker Sport 2. We don’t believe that this change significantly affected the results, and both of these issues are marked in our spreadsheet with the data.
Research on Flatground Throws
The most relevant paper to this study is “Biomechanical Comparison of the Interval Throwing Program and Baseball Pitching.” The study had 29 college baseball players throw off a mound and at various flatground distances, essentially from flatgrounds to long-toss.
The researchers found that throwing from flatground at 18m (roughly 60 feet) resulted in “essentially identical biomechanical loads compared with pitching at full effort from the mound.” This is surprising considering flatground throwing produced significantly decreased velocity (82% of maximum). The researchers in the study suggest that this may indicate lower throwing efficiency from flatground. This may be true, and obviously pitchers are training to be in sync on the mound instead of on flatground.
Both this study and our results suggest that the differences between flatground and mound work are much smaller than believed.
Another study with results similar to ours was on adolescent baseball players. Looking at youth athletes from ages 9-14, the researchers found that pitching on a mound resulted in 33.3 Nm of torque on the elbow while throwing on flatground was 31.4 Nm, a relatively small but significant difference similar to what we saw with our own data.
Youth athletes experience less torque, therefore, there cannot be a direct comparison to our data because we use college athletes. Regardless, it is still an interesting observation.
Coaching Applications
There are a couple notable points that come to mind when looking at this data and how it can help coaches and players approach practice differently.
Intensity of Throwing
Athletes are not great at monitoring their own intent levels. At times, radar guns can be used to give athletes limitations: for example, saying they can’t throw over a certain velocity. We’ve used this in specific rehab settings, but it can also be used for light bullpen and flatground work.
Since the large majority of baseball bullpens and flatgrounds are thrown without a radar gun, we find athletes are often throwing harder than they think. We used a radar gun during our study and still found higher than expected velocities.
This means that if you tell athletes to throw flatgrounds at 70-80% intensity, there is a good chance that they are throwing harder than 70-80%.
Some may assume that 75% intent may be close to 75% velocity but that is highly unlikely. When you write out what the actual percentages of an athlete’s peak velocity, this starts to make more sense. Actual velocity percentages of peak velocity are, most likely, much lower than what people expect.
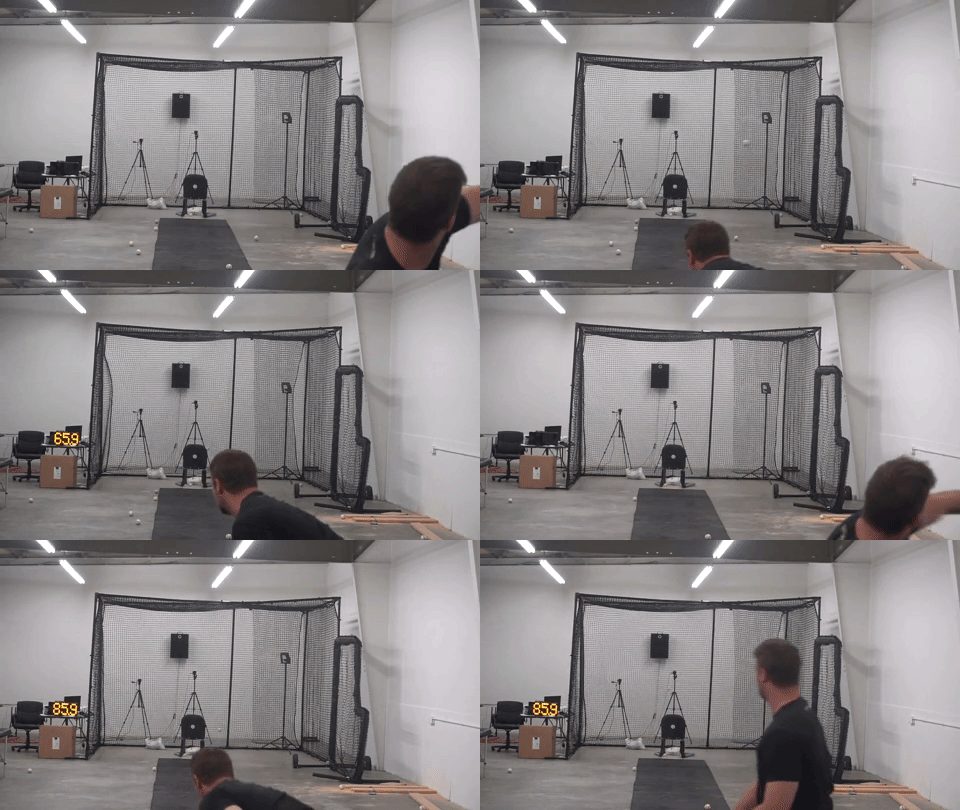
To help put this in perspective we also made a video comparing various velocities.
Throws from approximately 60 MPH to 85 MPH, increasing at 5 MPH increments.
Throwing at 75% of their actual velocity looks incredibly slow. This gif is a throw at 85.9 and at 65.9, which is between 75-80% of a ‘max’ velocity of 85.9.
Realistically, pitchers and coaches probably aren’t looking for pitchers to actually throw 75-80% of their max velocity, they are looking to throw at 75-80% effort. Which is perfectly fine, but 75% intent doesn’t mean you are experiencing 75% of the torques on your arm.
The previously mentioned “Biomechanical Comparison of the Interval Throwing Program and Baseball Pitching” also looked at perceived effort of throwing off of a mound and found that athletes not only have difficulty performing at a perceived effort level, but even if velocity has decreased, the torques on the arm may not. (This isn’t a direct comparison because it was only throwing off a mound, but it’s the closest we have currently.)
When pitchers were told to throw at 60% effort from the mound, they generated 75% elbow torque and were throwing at 84% of the velocity of a full-effort pitch. At 80% effort, pitchers were generating 90% elbow torque and 90% of the velocity of a full-effort pitch.
This clearly has some interesting implications for training, mainly that when told to train at a certain effort level, pitchers are most likely to experience greater torque (and throw at high velocities) than believed.
Looking at the numbers in our study, we see that even though we told all of our pitchers to throw at 70-80% intensity, they ended up throwing 89% of their max on average.
Our athletes threw their flatground throws at a wide range of percentages compared to their mound velocity: from 97% at the high end and 79% at the low end. So even though we recommended a range, only 1 out of our 25 athletes actually threw within that range.
The question then becomes, do we actually want pitchers to throw at certain percentages of their velocity? Or are coaches comfortable continuing to suggest athlete’s throw at a percentage of intent level, with the understanding that they will most likely be throwing harder than expected.
Training Economy
No throw an athlete makes is free, and everything has a training-economy cost. Even though the intention of many flatground practices is to do something nice and easy, what happens in practice doesn’t line up with that intention. Like we covered above, pitchers are often throwing harder than they believe and consequently incurring a higher training cost.
While the cost isn’t as high as pitching in a game, it’s certainly higher than thought. This doesn’t mean that we have to eliminate or drastically change how athletes throw flatgrounds, but since pitchers throwing them are incurring a higher training cost, adjustments should be made in the surrounding schedule for more recovery work.
Coaches and athletes shouldn’t see the flatgrounds as “no cost” when compared to the bullpen.
One piece of information we don’t have that would be helpful is data on a low-intensity bullpen, which we will look into in the future, both with the Motus Sleeve and our Biomechanics lab.
Knowing the differences between flatgrounds, low-intensity mound work, and in-game stress levels opens up a more specific and data-driven approach to planning practices and monitoring workloads.
Conclusion
Our data combined with peer-reviewed research suggests that flatground throws are equal or slightly less stressful than pitching off a mound. If you take velocity into account with our own data by the mStress metric, then flatgrounds become more stressful.
This strongly contradicts the widely held belief that flatground work, if thrown at lower velocities, if significantly less stressful than throwing on the mound. For example, if an athlete is throwing at 80% effort on flatground, he should be experiencing 80% of his max stress or less.
The belief that percentage of effort is equal to percentage of stress is most likely not true, and the data provides us with growing evidence that stress does not increase or decrease linearly with velocity.
More research needs to be done on different practice scenarios (such as low-intent mound work), but it is important to remember that every throw has a cost, and every training program should be wary of that when creating an athlete’s schedule.
This article was written by Research Associate Michael O’Connell, the data was collection by Research Interns Kyle Lindley and Anthony Brady
Want to learn more about what we know about pitching mechanics? Check out the wide array of blog articles we have relating to mechanics here.
Comment section
Add a Comment
You must be logged in to post a comment.


Blake -
Just out of curiosity, on average, do you guys know generally the velocity difference when pitching max-effort off a mound as opposed to pitching max-effort on flat-ground? As in how much velocity does the mound add?
Coaches Series: Off-Season Training Focuses - Driveline Baseball -
[…] We selected these athletes based on velocity development potential but also a need a more command focused program – based either on performance this past fall and/or last spring. After taking their baselines, we’ll introduce a differential component with 6 and 4 oz leather weighted baseballs. All throws are made from the mound, as we have transitioned away from flat ground work especially for command. A good indication of why is found in Comparing Flat Ground to Mound Elbow Torques. […]
Brett Wolfe -
Why throw flat ground st 80%? Not all flat grounds are thrown that hard. Of course it will be stressful if you throw flat ground at 80%. Good study but poor qualifier for flat ground as a comparison. What about flat ground st 60%. Like the day after the mound…